

(The Normal Distribution)
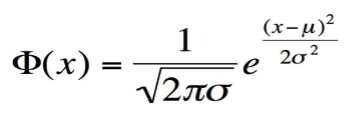
Not normal as in behavior or paranormal. Normal as in what you can expect the frequency of a particular prediction to be—probability. Like how I first noticed a certain phenomenon while running, but it’s also obvious on a bike, or even driving narrow streets. And how I heard the word clockwork three times last night in news reports and commentary. I wondered why such an obsolete word might pop up so often. Some things are very likely, and some things are rare or unusual (not like a rare coin, or I’ll have bacon-flavored ice cream instead of chocolate this time). Because we didn’t evolve to understand our universe. We evolved to survive it. Φ(x) is the probability that a certain value will occur in a population. I call it the parked car probability paradox because (il) logically there is no explanation for the frequency of which you must wait behind a parked car for traffic coming in the opposite direction to pass. Our brains are cluttered with built-in biases. Population as in a set of numbers generated by statistics, not necessarily the number of people in a community, or how many bats are in the attic. Running in place, idling, patiently waiting for safe opportunity to continue your journey. Instincts and reliance on mystical thinking—μ is the mean (and/or the median or the mode). As in ala mode, just like I like it.—xenophobia, aggression, passive aggression, prejudices and barriers to ratiocination—σ2 is the variance, as in not the mean, farther out, or far away. Not too far, but in the distance. As in Tatooine, as in, on second thought, I’ll have rocky road. There is never enough room for three objectives at once. σ is the standard deviation, as in walk 10 paces, turn, and shoot, as in 3 strikes and you’re out, as in it’s okay, I wasn’t really looking forward to the party, anyway. Because these traits helped us survive as a group. If you look at a normal curve, the standard deviation is shown as lines drawn down across the curve where most of the data is inside the lines. What data lies outside the lines is not as likely or common as what values lie inside. And it dawned on me, people feel safe placing the word clockwork in their sentences—safety built into our numbers—control by implication. There’s also a second standard deviation, and a third. By the time you get that far from the mean, it’s really, really unlikely, as in a fried egg returning to its shell, as in you are aware that you are the black sheep of the family. Safety is the infrastructure of identity. One must be patient and wait or else everything dissolves into chaos. of culture over apishness—of design over reptilian thinking—of religion over chaos. There are two ways of looking at the standard deviation. Navigating our modern world requires abandonment of this comforting clutter. One is, you go out and collect a lot of data. You line each value up in a table and then spin a curve that shows the most common values stacked up in the middle and the less common values straggling on the outsides. And embracing the fact we are all built this way. When you see this distribution in nature, it usually means there is a causal relationship with a range of possible outcomes. Like a dominant gene in a gene pool, or why aren’t you aware of your biases and microaggressions. the egoism that convinces us our roles in creation are safe. Our existence ordained, The other way is to expect a normal range and then evaluate an outcome of an experiment relative to that expected distribution. This is how you can make sense of causal relationships without a range on both sides, but maybe just one. Today I read, I don’t know where, a magazine of how the human mind selects observations to fit its perceptions. like time only goes forward, like I’ve shrunk an inch as I’ve gotten older. Allowing us the peace of mind to wake at the same time each morning. That’s why I suppose we all see things differently. e is the natural logarithm, Euler’s number. For some reason, it keeps popping up in nature, so it’s generally considered reliable even though it is irrational. Like π, which is also here, so I suppose, two irrationals make a right. And later that day I sat in a restaurant watching tadpoles turn to pollywogs and the waiter asked me if I liked Janis Joplin since he knows old guys sometimes do and she was playing on the T.V. as the pollywogs turned to frogs and jumped headlong into gene pool. The square root of 2π times the standard deviation forms a curve while limiting the outputs to positive values. Raising e to a complex exponent like (x-μ)2 over 2σ2 seems extreme, but this is where the variance from the mean gets distributed across the curve. And I lied to my wife about where I was since I was supposed to be at work, and my boss since I left work early, and my children who I will look in on when I get home. A big σ produces a more spread-out curve while a smaller σ produces a skinnier one. Watching them dream, sprouting legs, chasing ripples on the water, just as I did at their age. Now, it’s important to remember that a normal distribution only suggests causality but doesn’t necessarily guarantee it. Since you really can’t explain what events shape your life. Like the time I bumped into something in the lake while swimming, and I don’t know what it was, it was a long time ago, and memory fades as perceptions change. Or at least, not the cause you are expecting.
The Eye of God
Astronauts spacewalking from Gemini observed the Eye of the Sahara—thinking it might be the Eye of Horus—Molten bubble rising—Crust a blooming rose. Sediment providing fertile soil for Berber and Bafour farmers—Until drought pushed them south. The Eye has witnessed many migrations of Niger-Congo peoples—Arab conquest—French colonization. Its gaze remaining steady throughout drought-driven conflicts, slave trade, political upheavals. And it will continue its stoic watching as climate change expands the Sahara—Overwhelming the Sahel. Driving refugees across Mauritania—Into malnourishment, starvation, disease. Indifferent to the suffering. As if the unblinking Eye of God.

Bradley Earle Hoge’s second book of poetry, The Drake Equation, was published by VRÆYDA Press in 2022. His first book, Nebular Hypothesis, was published by Cawing Crow Press in 2016. His poetry appears in numerous anthologies and journals, most recently in Woodcrest Magazine, California Writers Club Redwood Branch Anthology: Phases, The California Literary Review, Fault Zone: Reverse, and Consilience. He has been a teacher, a children’s museum curator, a college professor, and a vagabond. He currently teaches English at the Episcopal Day Middle School in San Mateo, California.
